
Customers
57 hours without Dalton. Minutes with it.
An upgrade left an enterprise team's storage service one restart from a full outage. Three teams spent about 57 hours without finding the cause. Then they connected Dalton, and within minutes had the root cause and a fix to review.
- IndustryEnterprise AI and cloud platform
- EnvironmentKubernetes on AWS, with object storage and managed Postgres
- ClassificationPublic and anonymized. All identifiers removed.
A routine upgrade, wedged for 57 hours.
The customer runs a large Kubernetes estate on AWS. One of their services is a user-facing storage layer that holds customer data, and it was in the middle of a routine version upgrade.
The upgrade included a one-time data migration, and the migration stalled partway through. The new version will not serve traffic until that migration is marked complete, so the new pods crash-looped, and the old version would not start against a schema that had already moved on. That left a single un-upgraded pod holding up all of production.
57 hours of back and forth
The evidence that could explain the stall was all there. It just sat in three places: the live cluster state with the platform team, the logs with operations, and the code with engineering. No one could see all three at once, so the incident moved through tickets, threads, screenshots, and calls. Each theory took hours to check and led nowhere. A logging bug made it worse: every failed copy came through as <nil>, so the logs said nothing useful.
This went on for roughly 57 hours. Each handoff cost time, and none of them put all the evidence in one place.
For those 57 hours, a single pod restart stood between the service and a full outage, and every dashboard still read half-healthy.
57 hours in, they connected Dalton.
Dalton was already integrated with another cluster in the customer’s estate. The one that was failing had never been connected - so for 57 hours, Dalton could not see it.
The integration already existed for the other cluster, so connecting the failing one was a configuration change, not a project. From there, Dalton read the same three streams the team had been passing around by hand: the logs, the live cluster state, and the source code.
Minutes later, Dalton found what 57 hours of back and forth had not: the migrator copied each object with a single S3 call, and that call fails for anything over 5 GiB. The migration could not finish, no matter how many times it retried. Dalton backed the claim with evidence anyone on the team could check, and it killed the two theories the team was still chasing. It also laid out the real blast radius, which the dashboards did not show.
Then it proposed a fix, a multipart copy path for large objects, and opened it as a pull request. The engineers did not have to find the fix or write it. They read the diff, approved it, and re-ran the migration to completion.
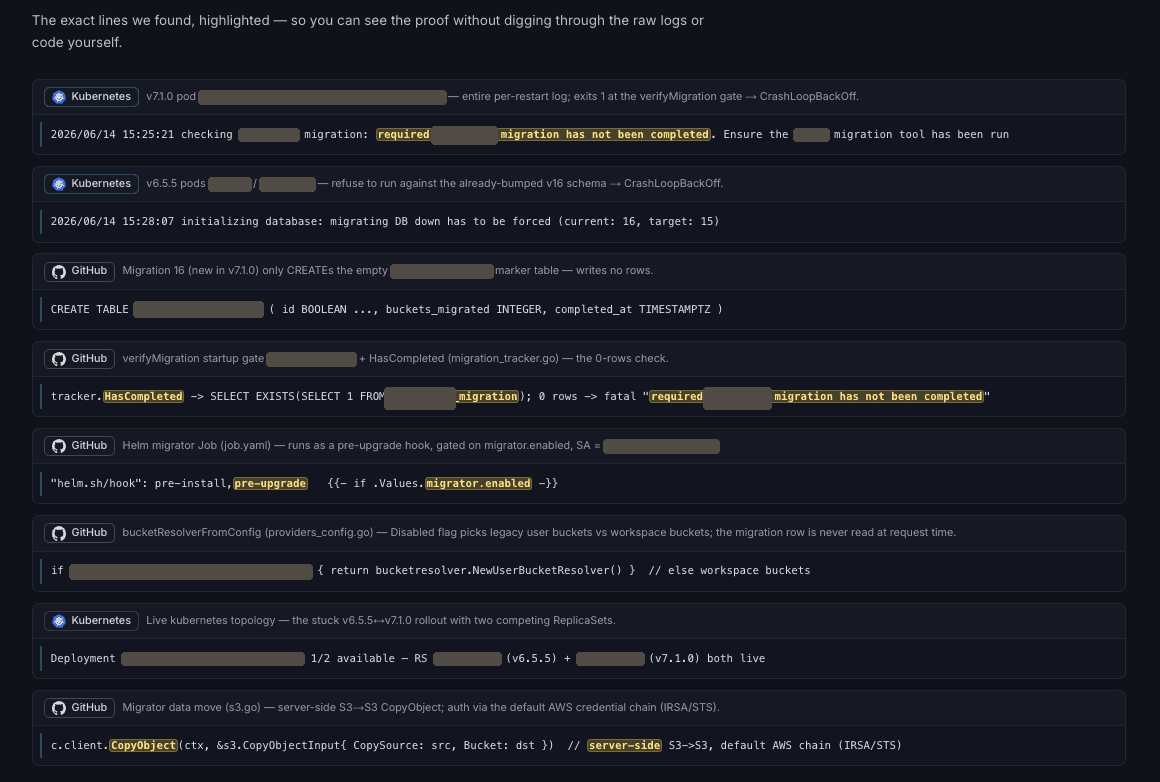
Every object was copied with a single server-side CopyObject call. S3 rejects that call for any source over 5 GiB, and the migrator had no size check and no multipart fallback - so the copy failed permanently, every pass.
S3Copier.CopyObject → InvalidRequest
source > 5,368,709,120 bytes (5 GiB)
Nothing about the incident changed between hour one and hour 57. The same logs, cluster state, and code were there the whole time, split across three teams. What changed on day three is that Dalton read them together.
The insights that took us hours to find and pass between teams, Dalton located and correlated in minutes. It worked the failure with us, inside our normal workflow.
The investigation.
These screenshots come straight from Dalton's investigation surface. We redacted the sensitive fields and left the analysis unchanged. Dalton anchored the investigation to when the failure began, not to when it got access.
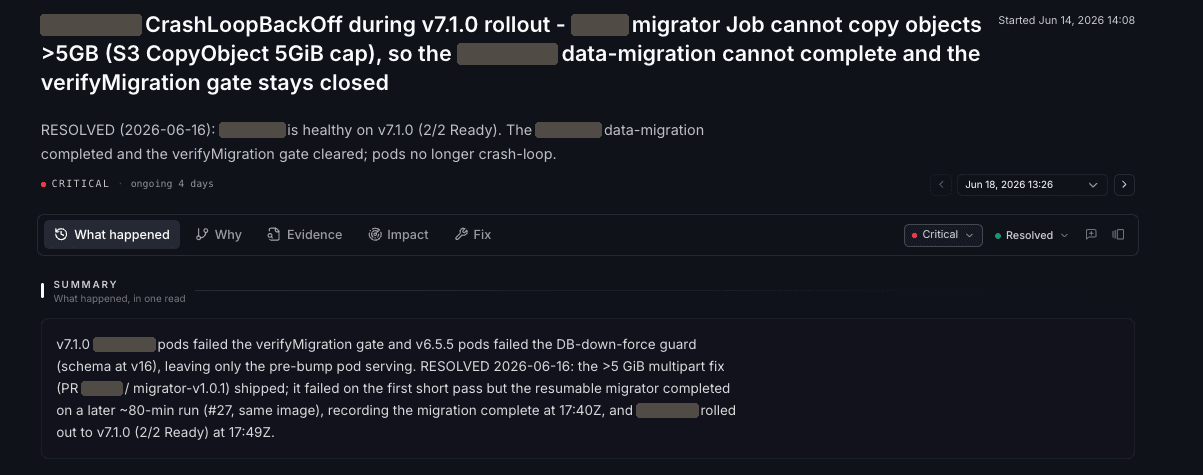
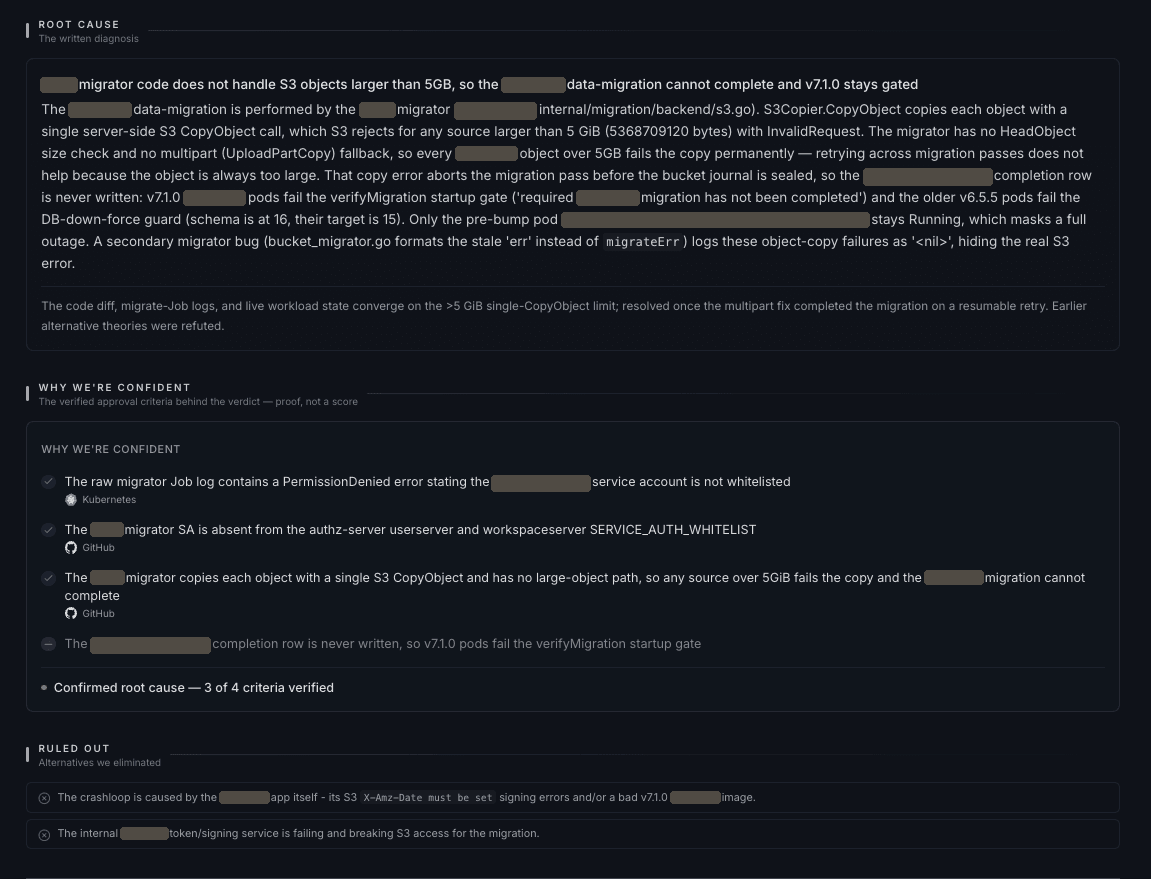
Evidence anyone on the team can check.
The signals behind this verdict sat in three systems, the same three the team had passed around for 57 hours. Dalton links each claim to the exact log or code line behind it, so anyone can check every step.
What the team got back.
One incident, measured both ways: roughly 57 hours as a manual cross-team investigation, then minutes once Dalton was connected. The before and after come from the same incident, not from an industry benchmark.
Root cause in minutes, on hour 57.
The problem was no easier on day three than on day one. The difference was that the logs, the cluster state, and the code were finally read together.
From suggestion to a shipped fix.
The missing multipart copy path arrived as a pull request with the evidence behind it. Engineers reviewed a diff instead of writing one. The rest was a supervised migration re-run.
The back and forth ended.
Platform, operations, and engineering stopped passing tickets and threads once the evidence sat in one place. Most of the team went back to building the product.
The real severity showed up.
The dashboards said half-healthy. Dalton said one restart from a full outage, which is the number the team needed to triage on.
Connecting Dalton was cheap.
It was already integrated with another cluster, so adding the failing one was a configuration change. It paid for itself on the same incident, within the hour.
One place for the whole incident.
The team discussed, investigated, and fixed the incident on the same surface, and their knowledge of the system combined with what Dalton found.
What this incident cost, with and without Dalton.
ROI tables usually lean on industry averages. This one uses the incident itself: ~57 hours before Dalton was connected, minutes after.
| Cost driver | Without DaltonHours 0-57, observed | With DaltonAfter connection, observed |
|---|---|---|
| Time to see and confirm the problem | Without Dalton~57 hours. Evidence sat in three teams and three tools, failed copies logged as <nil>, and each theory took hours to check and led nowhere. | With DaltonMinutes. Dalton read the logs, cluster state, and source code together, showed the stall’s real severity, and ruled out the remaining theories. |
| Fix effort | Without DaltonNever started. After 57 hours there was still no confirmed cause to write a fix against. | With DaltonReview and ship. Dalton proposed the fix as a pull request; the team read the diff, approved it, and shipped it. |
| People pulled in | Without DaltonThree teams plus management. Platform, ops, and engineering, plus the managers coordinating them, for the duration. | With DaltonOn-call plus a reviewer. Management involvement drops to status checks. |
| Exposure window | Without Dalton~57 hours spent one pod restart from a full outage of a customer-data service, invisible on dashboards. | With DaltonBounded within the hour. Dalton identified and sized the failure; after that it was the migration re-running. |
| Customer-facing cost | Without Dalton57 hours of SLA burn. Error budget drains, converts to credits once thresholds slip, and customers see degradation before it is explained. | With DaltonContained and explainable. Exposure bounded; the customer hears a confirmed cause and a plan, not “still investigating”. |
Run the same arithmetic on your own numbers.
incident cost = engineer-hours (investigation + fix) × loaded hourly cost
              + exposure hours × P(outage) × cost of one hour down
+ customer-facing cost: SLA slips, credits, reputationEngineer-hours
Before Dalton: three engineers at roughly 50% engagement across the ~57-hour window comes to about 85 engineer-hours of investigation. Those hours were spent, not modeled. After connecting Dalton: review of the proposed pull request and a supervised re-run, 2-4 engineer-hours. Net: 80+ engineer-hours returned on one incident.
Exposure
Usually the largest term. At your hourly outage cost, even a low restart probability over 57 hours costs more than the engineering time - and for those 57 hours a single pod restart was the only thing between the service and a full outage.
Customer-facing cost
This one comes from your SLA terms. Reputation has no line item, which is why it is the easiest cost to undercount.
The engineer-hours come from this incident. Loaded hourly cost, outage cost per hour, and SLA terms are yours. A Dalton POC runs on real incidents in your environment - and this one shows you can connect Dalton in the middle of one.
Run Dalton on your next incident.
A demo first, then a two-week proof of concept on your own production, read-only on every integration.